|
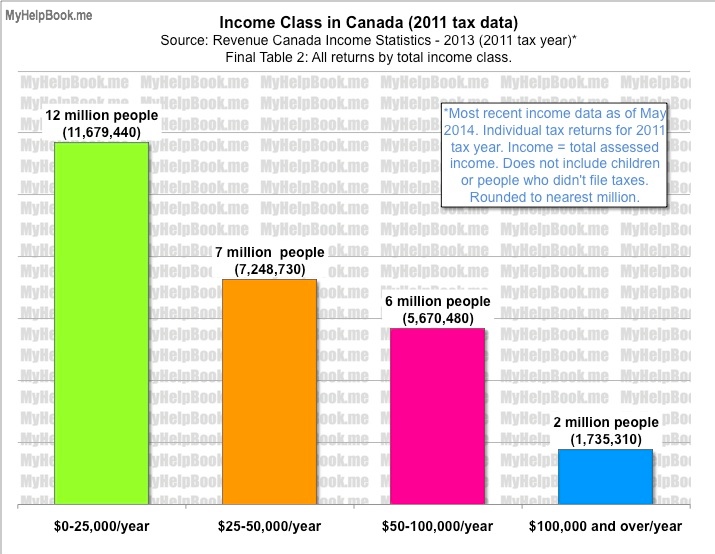
Revenue Canada's most recent Income Statistics* show there are 12 million people in Canada with incomes between $0-$25,000 per year, 7 million from $25,000 to $50,000, 6 million from $50,000 to $100,000, and 2 million with $100,000 per year and over. (Number of people rounded to millions). Because the information is from tax filers, it does not include dependent children or non-tax filers. (Also see "Notes" at bottom of page). *Canada Revenue Agency (PDF) Income Statistics 2013 (2011 tax year); Final Table 2 for all Canada; All returns by total income class. Data were taken from income returns and related schedules filed by individual for the 2011 tax year. For more detail see "Income Class in Canada in 13 Groups" Chart (bottom of page). Note: groups are $0-24,999, $25,000-49,999, $50,000 - $99,999, and $100,000 and over. The data label was not done in this way in order to make the chart simpler to read. The chart does not include dependent children and non-tax filers. These groups are included in Statistics Canada's chart on income class in Canada, however their chart obscures the size of each income group. (see 'Notes' section below). The chart above is broad because it is meant to serve a broad purpose. This income chart is an antidote to the wall-to-wall advertising and media images that create the poisonous perception that all but a very few people are living the high life. This perception contributes to a sense of failure that many young people (and others) feel because they have a low income. These skillful commercial images make people feel that having a low income is abnormal, when in reality, it is other way round. In addition, seeing real income numbers will hopefully help counter the perception that the democratic majority is very well-off and therefore should govern as if everyone has, or could have, a $100,000 a year job, a house, and a car (or two). From an environmental point of view, people in the lowest income groups should feel a sense of pride because they do the least damage to the planet: they have the smallest homes (if they can afford a home), drive the least amount (if they can afford a car), take the most public transit, fly the least, consume the fewest resources and have the smallest ecological footprint.** It isn't easy being green but we can at least take pride from this fact. Income Class in Canada in 13 groupsNotes:
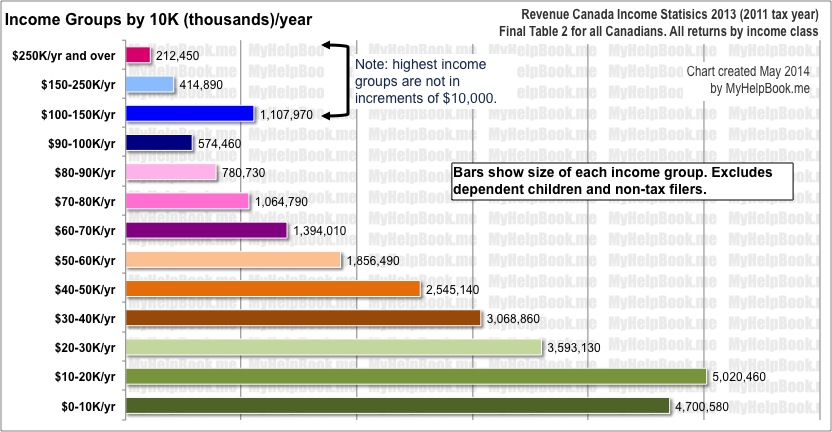
The chart above shows income groups in 10,000 increments such as $10-$20K and $20-$30K and so on. This was done for ease of reading but has created an inaccuracy of '1' for each category because Revenue Canada (CRA) income categories end in 9 (e.g. $5000 - $9,999, $10,000-$14,999 etc.). In the chart above income groups include the lowest number and 'up to' the highest. E.g. $10,000 up to $20,000. This is not a completely scientific representation of the numbers. But size of the bars in the chart are accurate and are what people need to see in order to compare sizes of income groups in Canada. Population of Canada is 35 million. Total number of people in chart is 26 million (because it excludes dependent children and non-tax filers). There may also be a small number of wealthy people in the $0 income group for various accounting reasons. Stats Canada also has an income chart using these CRA data and they include dependent children. However, their chart is confusing. Instead of showing how many people are in each income class, they show how many people are at a particular income level "and over". For example, you can't easily find out how many people are in the $10,000-$14,999 income class. Instead they tell you how many people there are with incomes of $10,000 and over. They also do not provide as many income groups as the report from the CRA. **The key factor in environmental degradation is not numbers of people, but the activities those people are doing, and it is economic factors that drive and determine those activities. For more information, read Vanessa Baird's important "No Nonsense Guide to World Population" or this article describing why blaming population for environmental harm is popular but pointing to economic factors is not. Related information:
3 Comments
5/27/2014 07:32:51 am
Hi Judy,
Reply
Leave a Reply. |
AuthorMy Opportunity & Help Book BC Categories
All
Archives
December 2020
|


 RSS Feed